2.1. Grafana connector
2.1.1. Introduction
Official QuasarDB Grafana plugin. It extends QuasarDB’s support to allow integration with the Grafana analytics and monitoring platform. You may read and download the connector’s code from GitHub at https://github.com/bureau14/qdb-grafana-plugin
2.1.2. Prerequisites
This documentation assumes you have:
Grafana installed and running.
Both the QuasarDB daemon
qdbdand the REST APIqdb_restrunning.
2.1.3. Installation
The easiest way to install the plugin is via the Grafana CLI
grafana-cli --pluginUrl https://github.com/bureau14/qdb-grafana-plugin/archive/|version_full|.zip plugins install qdb-grafana-datasource
Alternatively, you can clone the git repository to your Grafana plugins directory (this is usually /var/lib/grafana/plugins on Linuxed-based systems)
cd /var/lib/grafana/plugins
git clone https://github.com/bureau14/qdb-grafana-plugin.git
Finally, restart your Grafana server and the plugin will be added automatically.
2.1.4. Configuration
Navigate your web browser to Grafana’s datasource configuration, and click Add data source. You will see QuasarDB as one of the available data sources.
Note
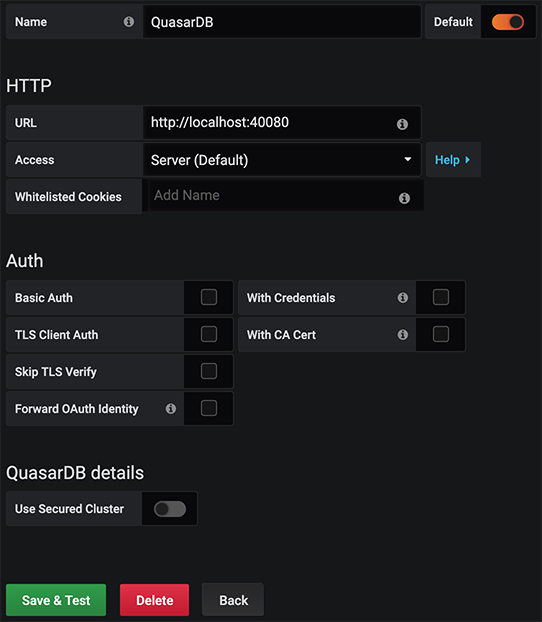
It is recommended to leave Access set to Server (Default) unless you specifically know otherwise.
If your cluster is not secured you just need to fill in the REST API URL (default is http://localhost:40080) into the URL field as shown below:
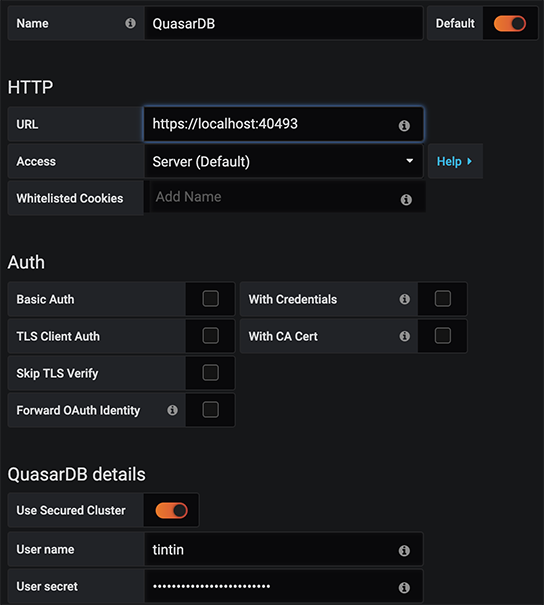
If your cluster is secured make sure to use the secure REST API URL (default is https://localhost:40493) when filling in the URL field.
Note
You may need to check Skip TLS Verify under Auth settings if you are using a self-signed TLS certificate.
Check the Use Secure Cluster checkbox and fill in the User name and User secret fields using the information found in your user private key file as shown below:
After you are done, click Save & Test and you are ready to starting creating visualizations using QuasarDB.
2.1.5. Usage
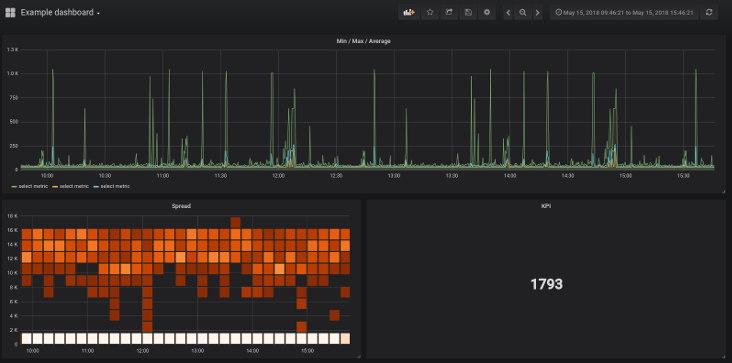
You can add a visualization using QuasarDB by selecting the QuasarDB Data Source when creating a new visualization.
In additional to normal query syntax you can the $__range and $__interval variables provided by Grafana.
For example the query:
SELECT * FROM stocks.apple IN RANGE(2007, 2008) GROUP BY 1h
Could be written to use Grafana’s variables like this:
SELECT * FROM stocks.apple IN $__range GROUP BY $__interval
For more information on query syntax see our query language reference