3.2. Grafana connector#
3.2.1. Introduction#
Official QuasarDB Grafana plugin. It enables seamless integration between QuasarDB and the Grafana analytics and monitoring platform . You can view the source code and download the connector from the official GitHub repository .
3.2.2. Prerequisites#
This documentation assumes you have:
Grafana installed and running .
Both the QuasarDB daemon
qdbdand the REST APIqdb_restrunning.
3.2.3. Installation#
The easiest way to install the plugin is via the Grafana CLI
$ grafana-cli --pluginUrl https://github.com/bureau14/qdb-grafana-plugin/releases/download/v3.14.2/qdb-grafana-plugin.zip plugins install qdb-grafana-datasource
Alternatively, you can clone the git repository to your Grafana plugins directory (this is usually /var/lib/grafana/plugins on Linuxed-based systems)
$ cd /var/lib/grafana/plugins
$ git clone https://github.com/bureau14/qdb-grafana-plugin.git
Finally, restart your Grafana server and the plugin will be added automatically.
3.2.4. Configuration#
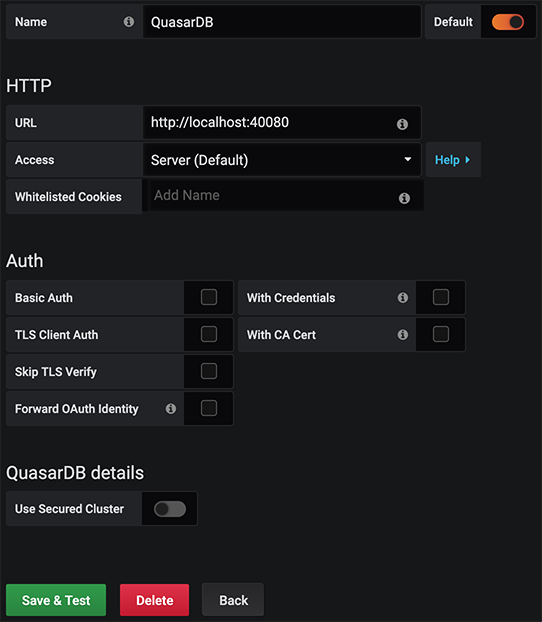
Navigate your web browser to Grafana’s datasource configuration, and click Add data source. You will see quasardb-datasource as one of the available data sources.
If your cluster is not secured you just need to fill in the REST API URL (default is http://localhost:40080) into the URL field as shown below:
If your cluster is secured make sure to use the secure REST API URL (default is https://localhost:40493) when filling in the URL field.
Fill in the User name and User key fields using the information found in your user private key file as shown below:
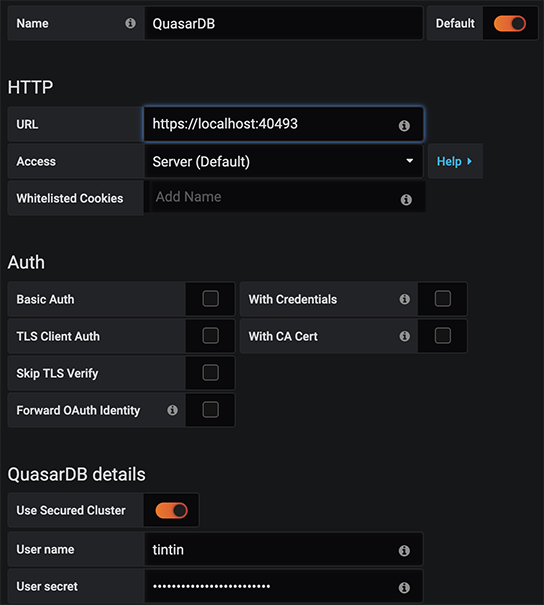
After you are done, click Save & Test and you are ready to starting creating visualizations using QuasarDB.
3.2.5. Usage#
3.2.5.1. Quering#
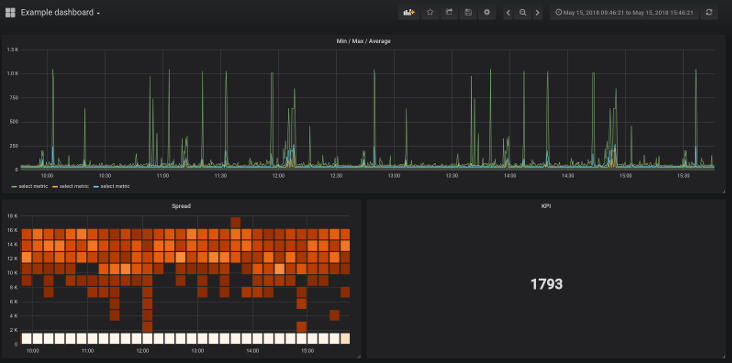
You can add a visualization using QuasarDB by selecting the QuasarDB Data Source when creating a new visualization.
In addition to normal query syntax you can use the $__range and $__interval variables provided by Grafana.
For example the query:
SELECT * FROM measurements IN RANGE(2007, 2008) GROUP BY 1h
Could be written to use Grafana’s variables like this:
SELECT * FROM measurements IN $__range GROUP BY $__interval
For more information on query syntax see our query language reference.
3.2.5.2. Query variables#
Query variables enable you to create more interactive and dynamic dashboards by writing a data source query that can return a list of tables, column values, tag values. Query variables support number and string values.
For more information on how to use Grafana variables check the official documentation .
3.2.5.2.1. Adding query variables#
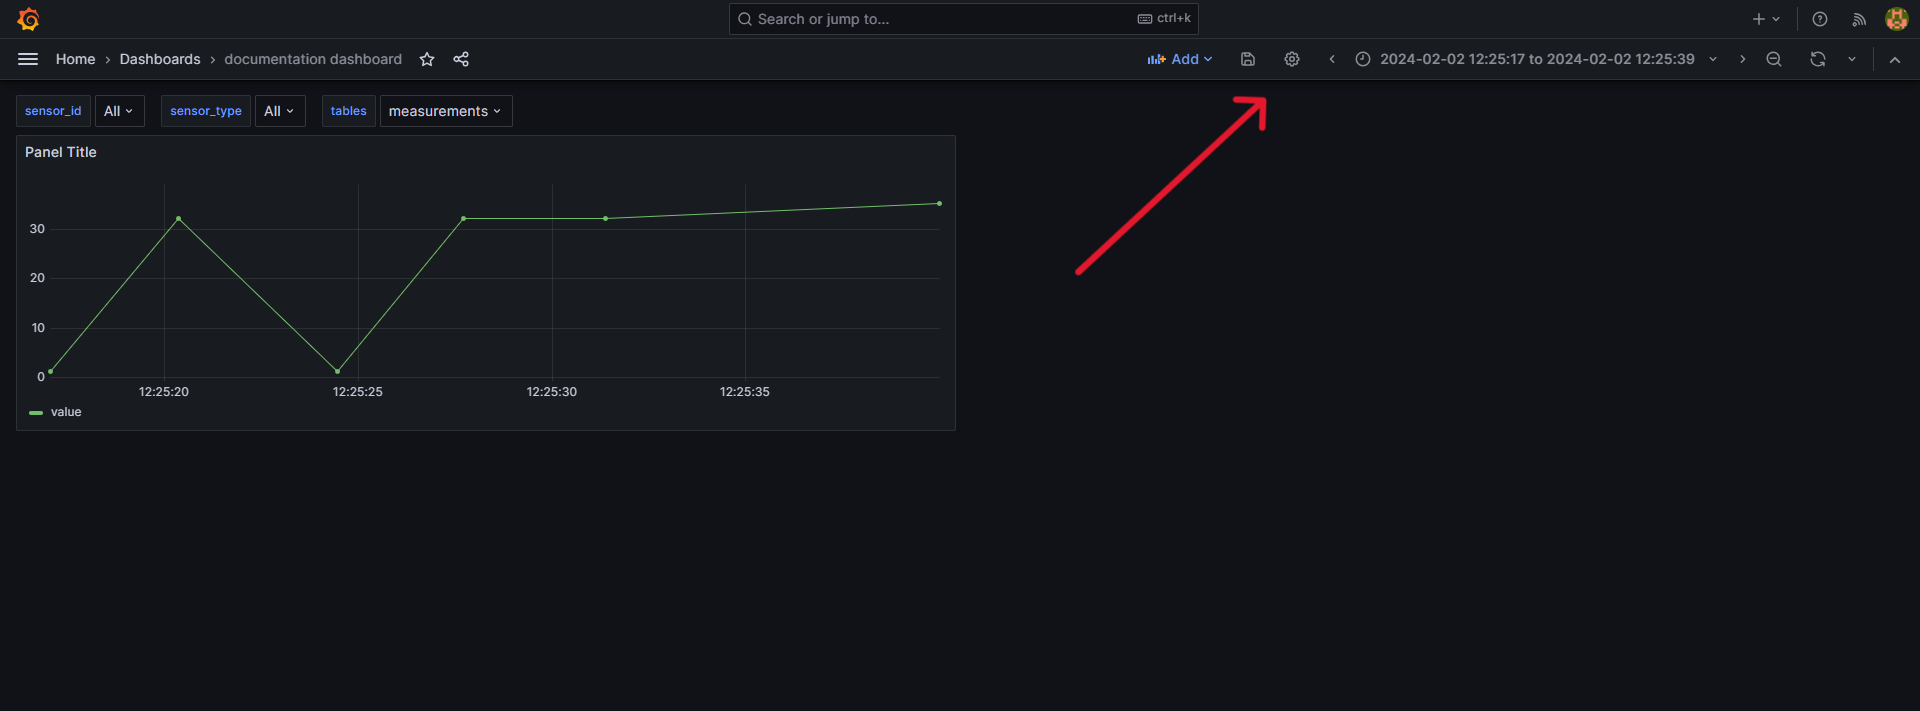
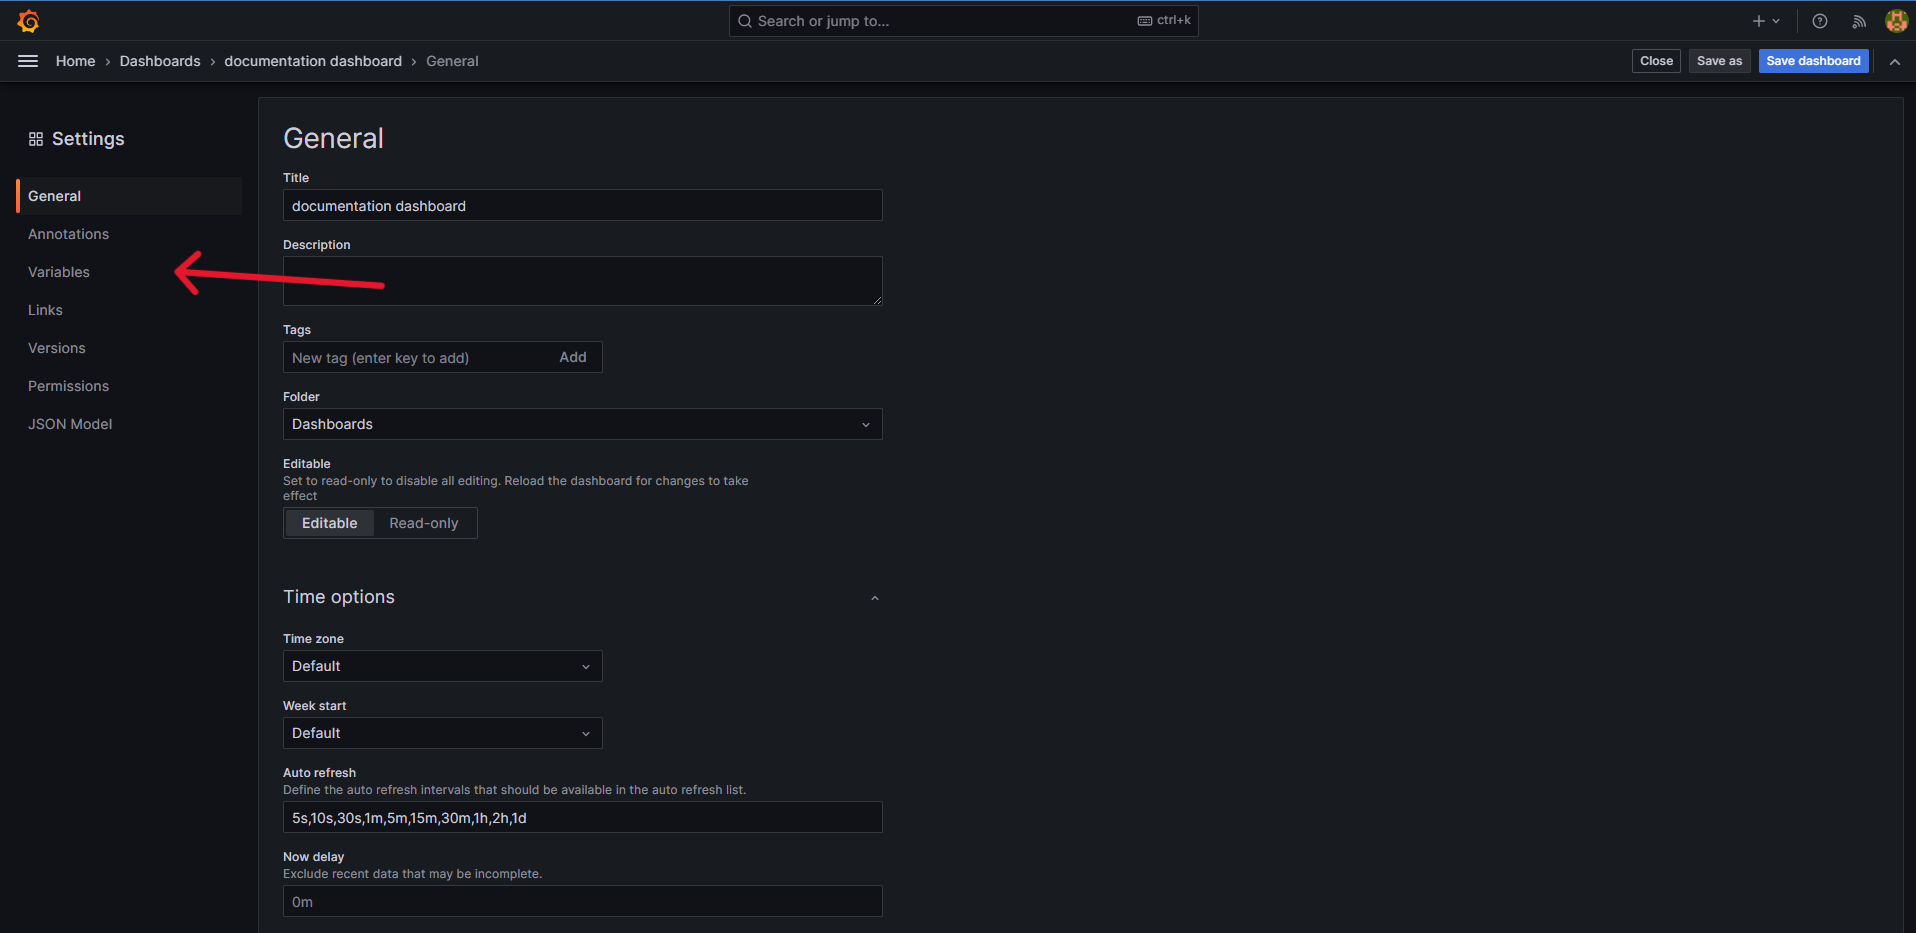
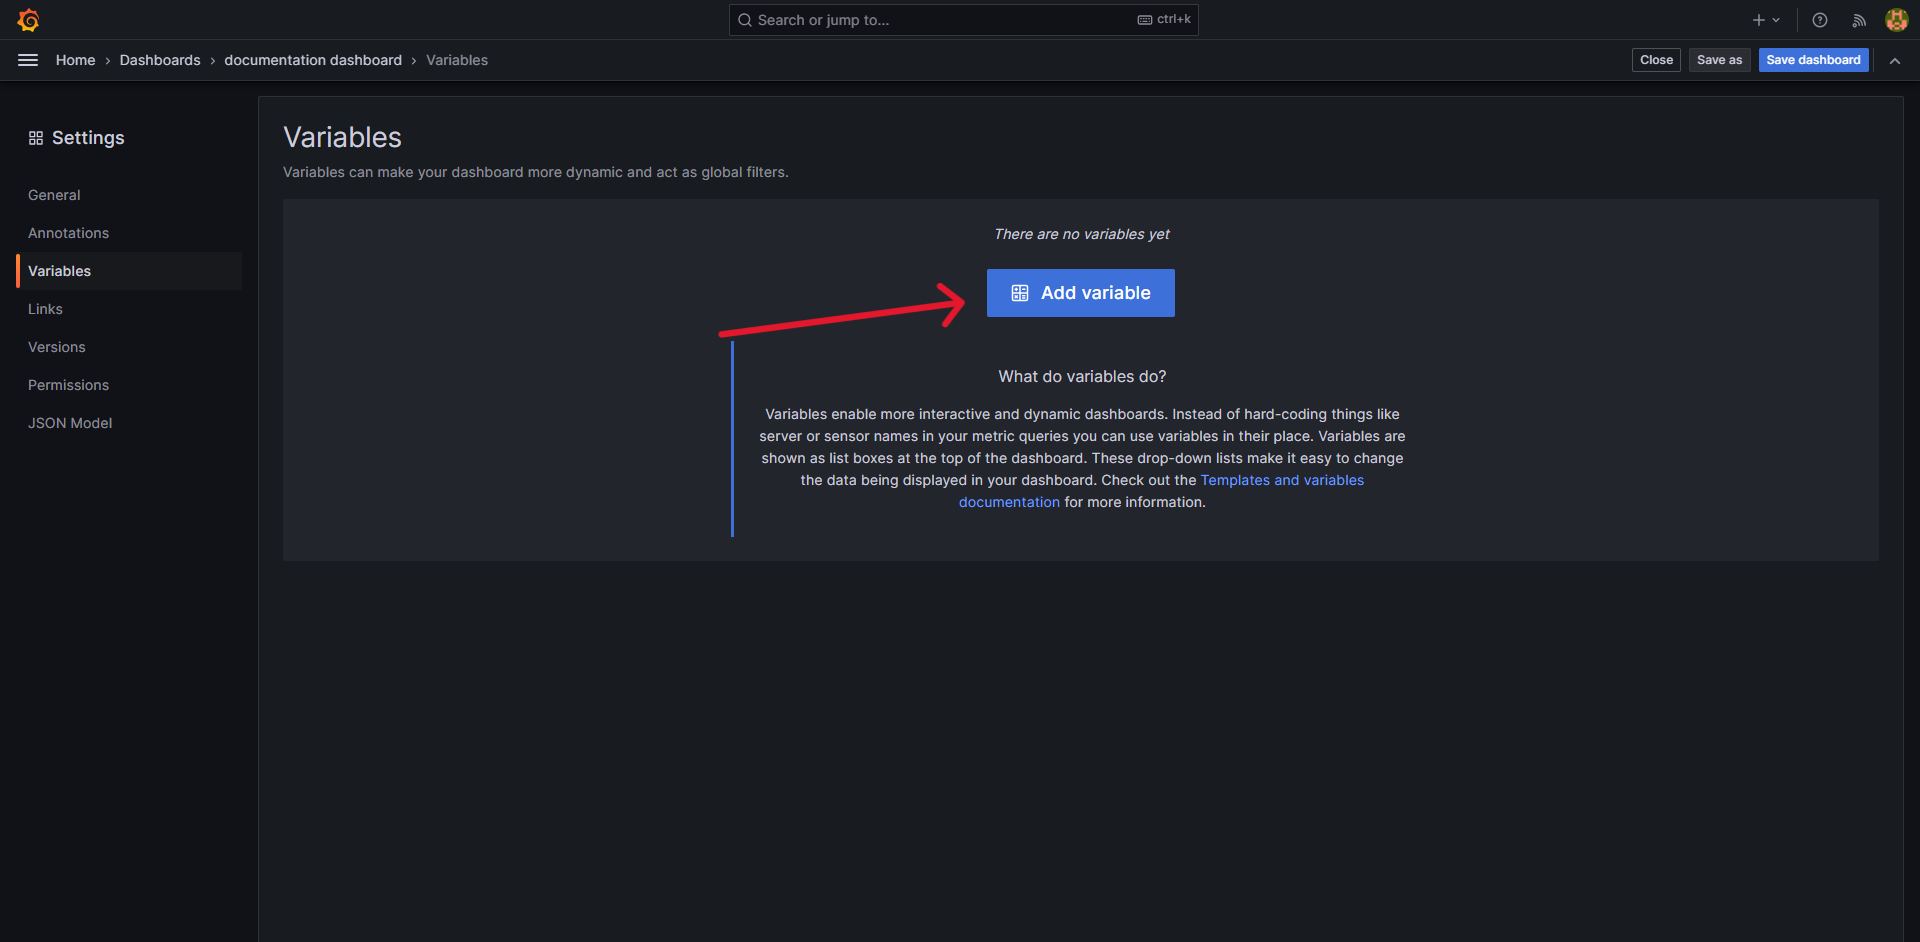
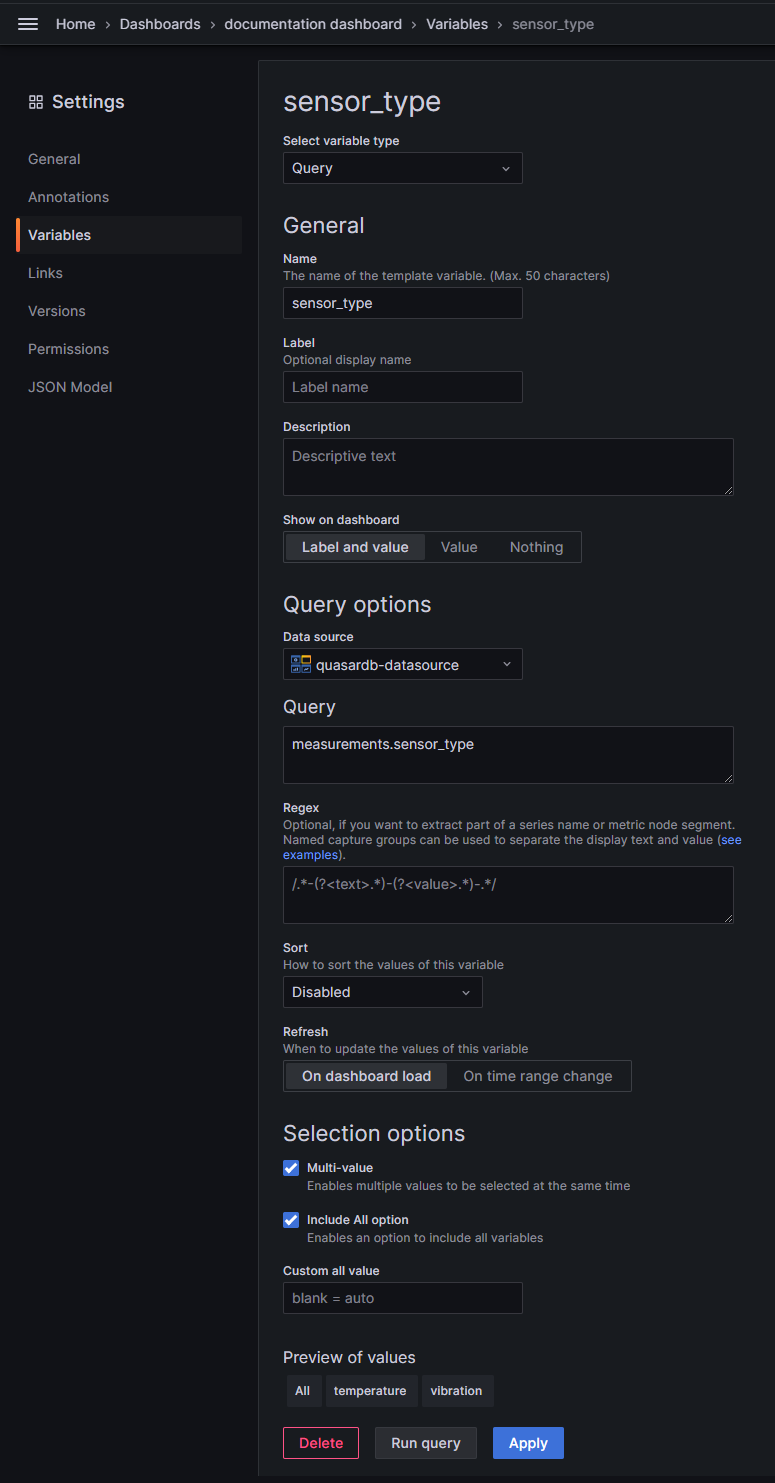
In your dashboard view go to dashboard settings -> variables and click on add new variable.
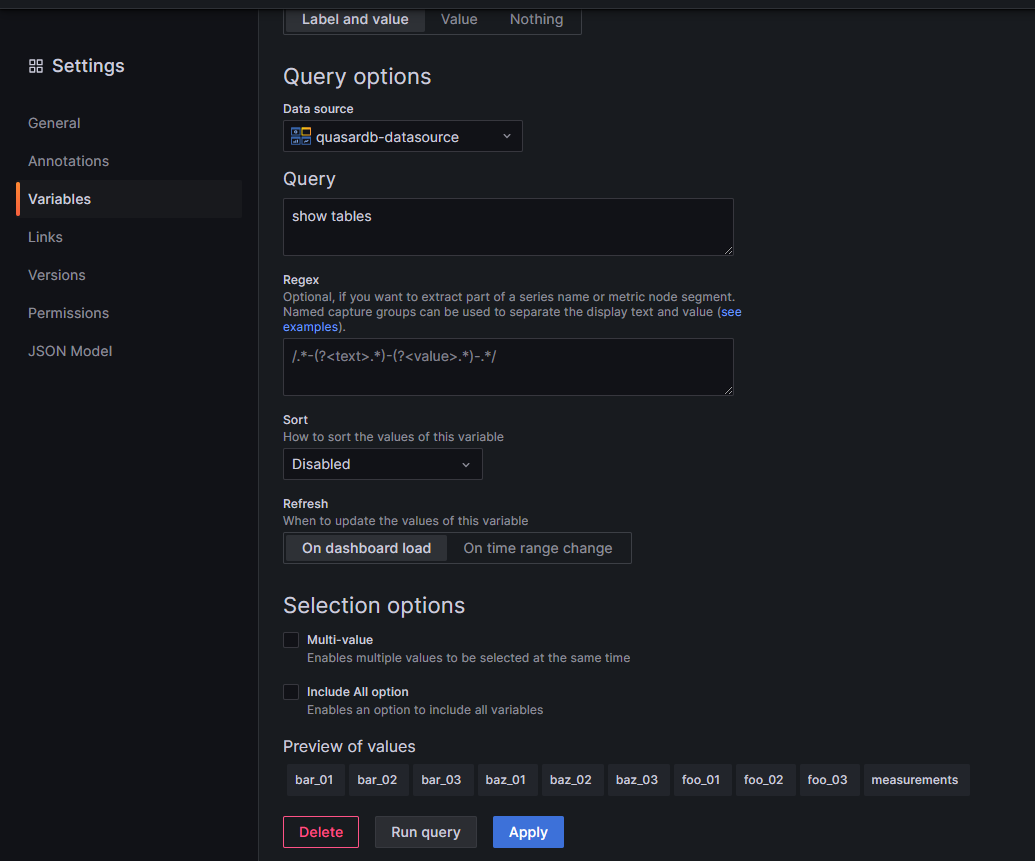
In query options select your QuasarDB datasource
Insert query in Query textbox
Run query to verify results, apply changes.
Note
Query variables are formated as column_name=column_value. This makes it easier to reuse in queries. If no column_name is provided (e.g: when listing tables) query variables are formated as column_value only.
3.2.5.2.2. Creating query variables using simplified query syntax#
For simpler queires where you want to select distinct values from column you can use simplified query syntax. This reduces the likelihood of errors in queries and speeds up creating simple variables.
For more complex queries you can use your own queries.
Example usage of simplified query syntax in Grafana:
Query:
SELECT column FROM table GROUP BY columncan be written as:
table.columnNote
Table names containing
.,/charactes should be placed inside double quotes.
Note
By default if Include all option checkbox is checked All variable is set to 1=1.
3.2.5.2.3. Quering using query variables#
Single value variables are replaced with their values.
For example:
Grafana query:
SELECT * FROM measurements WHERE $sensor_idwill be translated to:
SELECT * FROM measurements WHERE sensor_id='sensor1'
You can olso use multiple values of a variable in query by selecting Multi value checkbox when creating it. By default all vaues are joined with OR.
You can change this behaviour by including variable inside one of special variables listed below:
$__or- splits variables with OR$__and- splits variables with AND$__comma- splits variables with ,
Examples:
Grafana query:
SELECT * FROM measurements WHERE ${sensor_id}will be translated to:
SELECT * FROM measurements WHERE (sensor_id='sensor3' OR sensor_id='sensor2')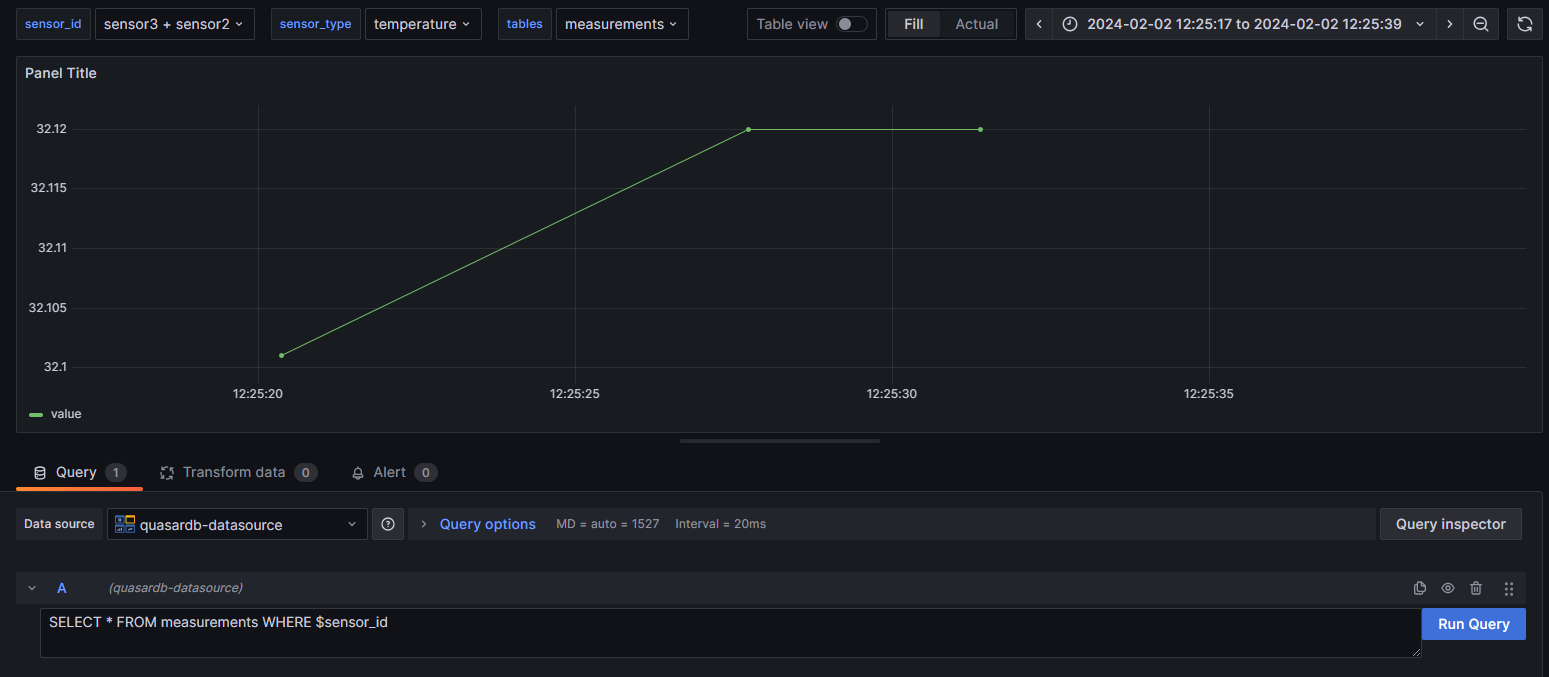
Grafana query:
SELECT * FROM measurements WHERE $__or($sensor_type)will be translated to:
SELECT * FROM measurements WHERE (sensor_type='temperature' OR sensor_type='vibration')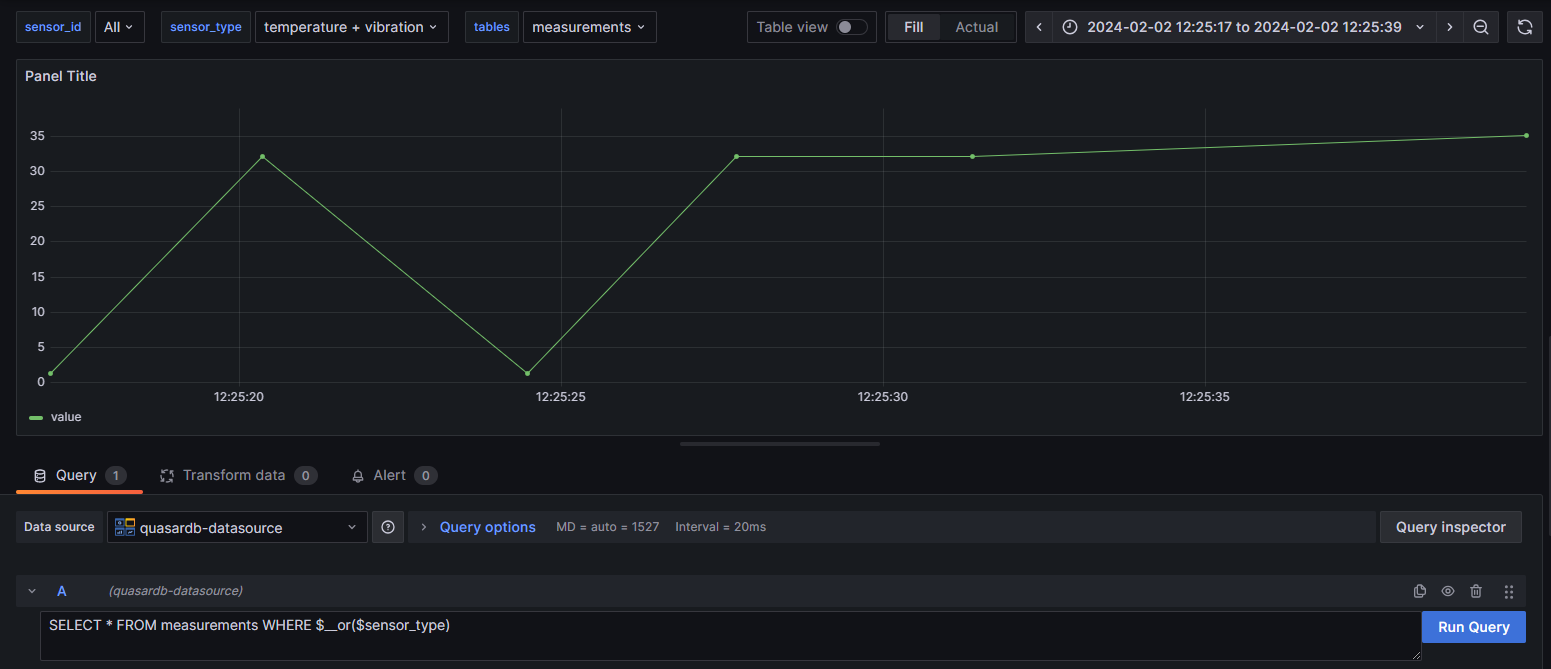
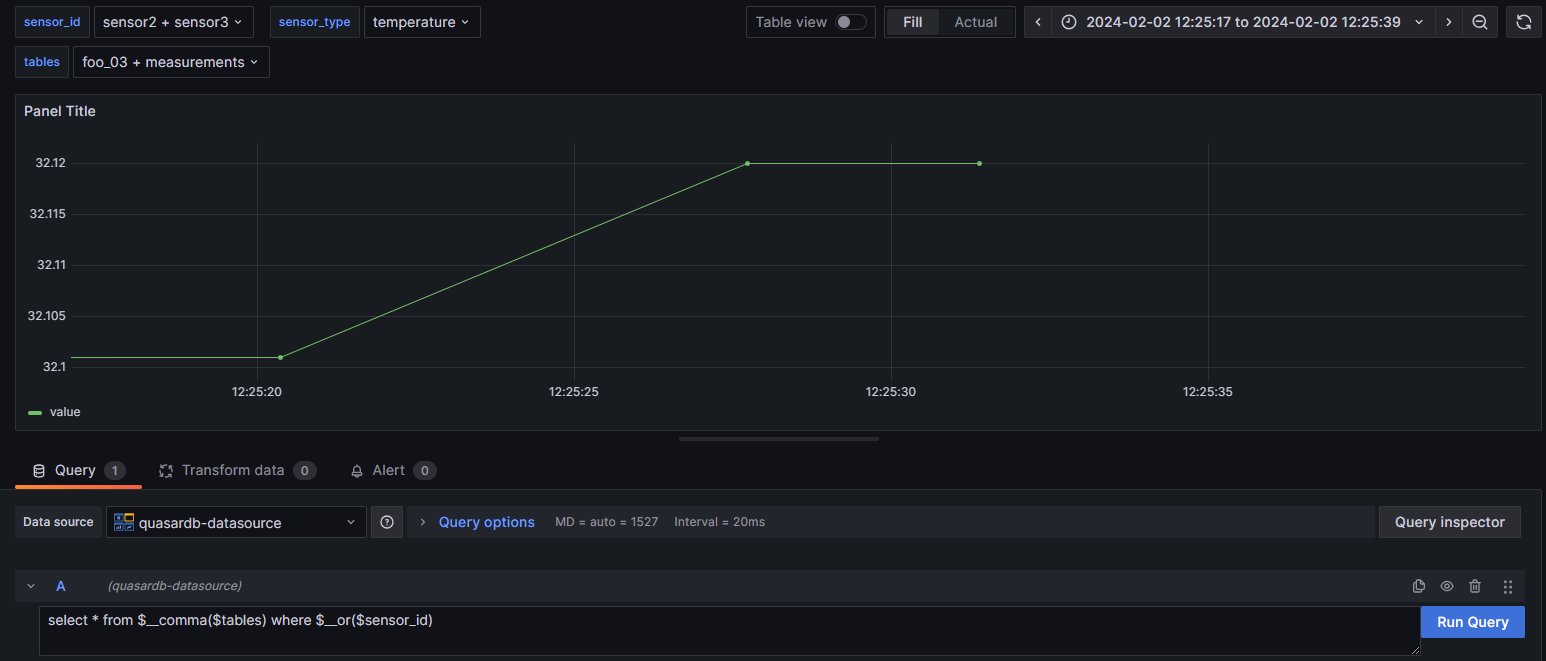
Grafana query:
SELECT * FROM $__comma($tables) WHERE $__or($sensor_id)will be translated to:
SELECT * FROM foo_03, measurements WHERE (sensor_id='sensor2' OR sensor_id='sensor3)